The Ultimate Forward Rate (UFR) is an essential element in the construction of the risk-free yield curve provided by EIOPA. It corresponds to the rate towards which the extrapolation of the yield curve converges beyond the Last Liquid Point (LLP).
Calculation methodology
Initially set at 4.2% in 2011 for QIS5 needs, the value of the UFR had not changed for the entry into force of Solvency II on the 1st of January 1st 2016. In 2017, EIOPA drafted a calculation methodology for determining the UFR on an annual basis. Since then, it has published the UFR applicable for the following year every spring.
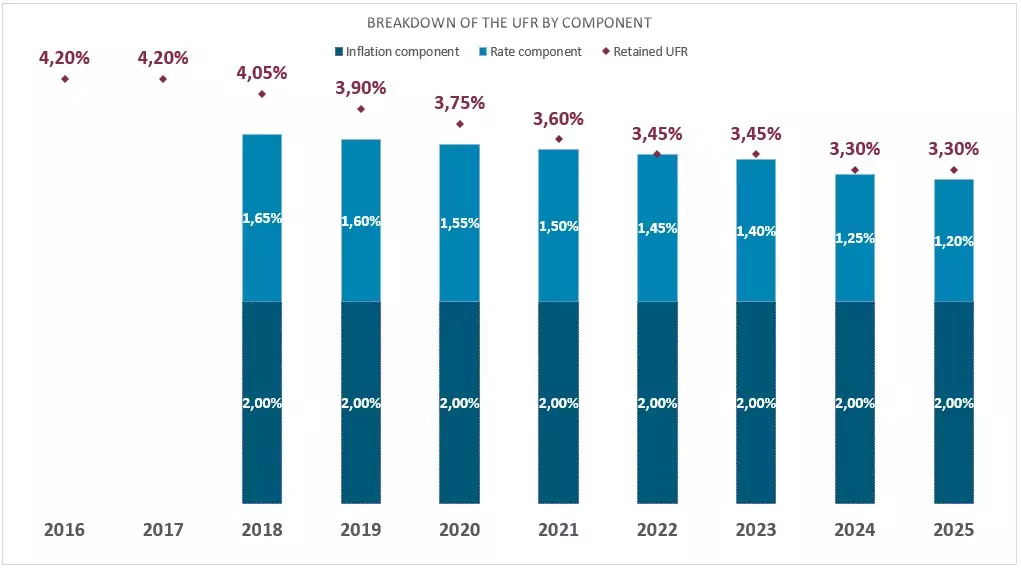
The UFR is determined for each currency as the sum of two components:
- an interest-rate component, corresponding to the average of long-term real rates observed since 1961 on a set of reference markets (Germany, France, Belgium, Italy, the United States, the United Kingdom and the Netherlands)
- a target inflation component, usually equal to the inflation target defined by the reference central bank. For the euro, the ECB has set it at 2%.
The UFRn is obtained comparing the value (Sn), sum of these two components, with the UFRn-1 +/- 0,15 %. More concretely:
- UFRn = UFRn-1 – 0,15 % si Sn < UFRn-1 – 0,15 % ;
- UFRn = UFRn-1 + 0,15 % si Sn > UFRn-1 + 0,15 % ;
- UFRn = UFRn-1 otherwise.
Thus, the UFR :
- remains unchanged if the expected variation is less than +/- 15 bps ;
- varies by +/- 15 bps otherwise.
Without this rule, the 2018 UFR, for example, would have been 3.65% rather than 4.05% (see chart below).
Value of the UFR in 2025 for the euro currency
For 2025, EIOPA has published a UFR applicable to the euro currency unchanged from 2024 at:
UFR 2025 = 3,30%
Historical values of the UFR for the euro currency

UFR and LLP evolution
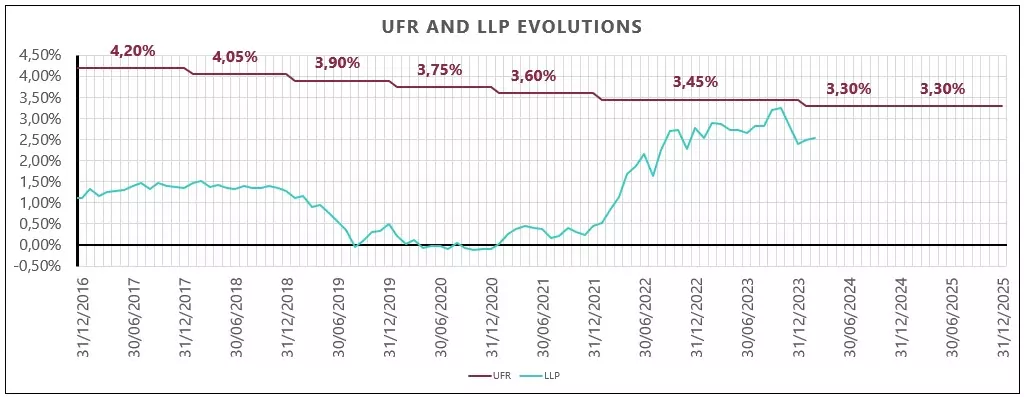
The graph below shows the historical values of the UFR and the interest rates at the LLP.

Whereas the rate at maturity of the LLP is a market rate and therefore subject to market volatility, the UFR was designed to provide long-term stability in the Solvency II framework. The recent sharp rise in interest rates has brought the LLP rate very close to the UFR, resulting in a relatively flat extrapolated part of the yield curve.
You can find the full EIOPA publication here: https://www.eiopa.europa.eu/eiopa-publishes-ultimate-forward-rate-ufr-2025-2024-03-27_en
This content is written by

Elie MERYGLOD
Senior Manager – Modeling & Risk Life

François BAYÉ
Director – Deputy Head of Actuarial Consulting
In-Depth Insights on Solvency II
Explore our complimentary blog articles for related content on Solvency II:

Launch of the EIOPA 2024 stress test exercise
On April 2nd, EIOPA launched its stress-testing exercise for the year 2024. Find out more about the scenario and the methodological approach applied in the synthesis produced by our experts.

Risk-free rate curves and EIOPA data
Each month, Addactis lists and summarizes the economic parameters used to produce the solvency ratio and the economic balance sheet: risk-free rate curves, volatility correction, symmetrical equity adjustment, etc.

2020 review of the solvency II directive
After situating this step in the overall timetable for the 2020 review, Addactis experts offer you a summary of the major changes at level 1 (directive) related to Pillar 1, and the issues still to be addressed at level 2 (delegated acts).

