Understanding the epidemiological dynamics, particularly in the current situation marked by the spread of COVID-19, is fundamental in order to adequately apprehend the associated risks. Various relatively intuitive models can be used to explain the dynamics of contamination by COVID-19 (see the Addactis article The origins of epidemiological dynamics). However, those models cannot be used for prediction purposes as they are based on multiple approximations. Therefore, they cannot replicate the pandemic dynamics associated with various categories of individuals. To overcome these difficulties, epidemiologists often use SIRD-type models that allow real-time dynamization of four compartments (Susceptible – Infected – Recovered – Deaths) of the population and their respective interactions.
This article aims to detail SIRD modelling and apply it to French data set related to the spread of COVID-19.
The compartments of SIRD models
SIRD-type models are based on a segmentation, at each particular time, of the underlying population into several compartments: uninfected individuals Susceptible of contracting the disease (compartment S), Infectious individuals (compartment I), previously infected and Recovered individuals (compartment R) and individuals who Died following their infection (compartment D).
As a first approximation in SIRD modelling, recovered individuals are considered immune to the disease[1].
Note: in some advanced versions of SIRD models, the incubation period is taken into account for the projection of the different compartments. For didactic purposes, the model subsequently detailed will not incorporate this characteristic.
The following diagram illustrates the possible transitions between each compartment:

The parameter α (respectively β, γ) correspond to the infection rate (respectively recovery rate, case-fatality rate) of the model. These elements are detailed below.
Noting S(t), I(t), R(t) and D(t) and respectively the cumulative number of susceptible, infected, recovered and deaths cases in t (most often for a daily unit of time), the evolution of the number of individuals in each compartment can be approximated by the following system of equations:

With:
- N the initial population size;
- α the infection rate, corresponding to the product of the probability of contamination and the average number of individuals encountered by an infected person at each unit of time. This parameter is adjusted by the part of the population that can be contaminated (quantified by the ratio ), to take into account the depletion of the number of susceptible over time;
- β the recovery rate: the average rate of infected individuals recovering per unit of time. Its inverse represents the average recovery time of an infected patient;
- γ the case-fatality rate: this is the average rate of infected individuals who die per unit of time.
The basic reproduction number: definition and estimation
One of the main indicators for monitoring the contagiousness of an epidemic is its reproduction number, noted ℜ0. This is the average number of people infected by an infected person during the period of contagiousness.
When ℜ0 is greater (respectively lower) than 1, the epidemic is spreading (respectively gradually dying out).
In SIRD modelling, the reproduction number is calculated as follows:

Different empirical approaches can be used to estimate the value of ℜ0 on epidemiological data sets.
Under equivalence assumption S ≈ N (i.e. the number of susceptible is close to the initial population size), it is observed that:

This results to the estimate of the reproduction number through linear regression of the series (CΔI(t) + CΔR(t) + CΔD(t))t on the series (CΔR(t) + CΔD(t))t.
With CΔI(t), CΔR(t) and CΔD(t) representing cumulated increments, respectively of I, R and D between the initial time and t.
The parameter ℜ0 corresponds to the slope of the linear regression detailed above. This valuation method is presented in the article by Anastassopoulou et al. [3]
Furthermore, as mentioned above, ℜ0 is a key indicator for reporting the contagiousness of a pandemic episode, reflecting its spreading potential. If α > β + γ, the epidemic is likely to spread. Otherwise (i.e. if α < β + γ), the epidemic is gradually dying out.
Methods for estimating SIRD model parameters
Different approaches allow empirical estimation of recovery and case fatality rates on data sets associated with COVID-19. The method used here is based on linear regression, consistent with the method detailed by Anastassopoulou et al. [3].
In-depth analysis of the SIRD model leads to estimates of case-fatality and recovery rates though linear regression of the series (ΔR(t))t and (ΔD(t))t on the series (CΔI(t – 1) – CΔD(t – 1) – CΔR(t – 1))t.
The estimators of the parameters β and γ correspond to the slopes of the linear regressions detailed above.
Finally, it is possible to derive the value of the infection rate parameter α from the equation (5) characterizing the reproduction number and the estimates of previous factors. Therefore, this rate is estimated as follows:

An alternative approach to estimate infection, recovery and case fatality rates is to minimize the sum of the square differences between observed and theoretical numbers of infected, dead and recovered individuals. In practice, this leads to solve the following optimization program:


Calibration of the SIRD model on French COVID-19 data set
The parameters of the SIRD epidemiological model were calibrated on French data for the period between 21/02/2020 and 20/04/2020[2].
The basic reproduction number obtained by linear regression on the data included in the first epidemic phase is 2.93. This order of magnitude is consistent with assessments published by various experts since the beginning of the COVID-19 crisis (see Massonnaud et al. [5] and the report of the Imperial College COVID-19 Response Team [6]).
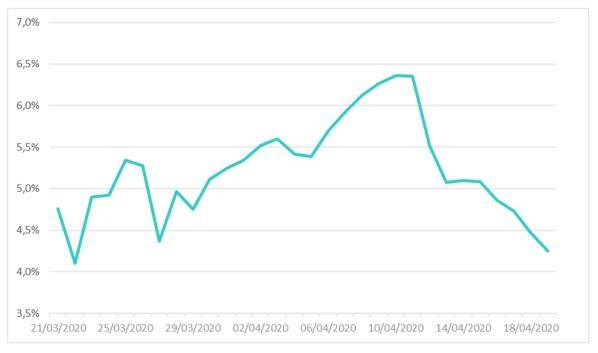
Figure 1 shows the change in the recovery rate estimated by linear regression on previously introduced data set. To ensure the reliability of the estimate of this parameter and to eliminate outliers, the estimate of this parameter was carried out over a more recent range.

Figure 1: Recovery rate of the SIRD model estimated on French data between March the 21st and April the 19th
The graph shows a changing trend in the profile of values for this parameter; with the pivot date roughly corresponding to the epidemic peak. The estimated rate averages 5.23%, corresponding to a recovery time around 19 days.
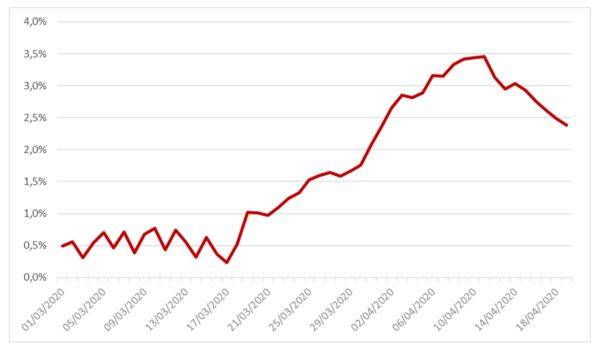
The case-fatality rate is also estimated using a linear regression on data set introduced above. For the same reasons as those given for the representation of the recovery rate, the estimate of this parameter was carried out over a more recent range.
The following graph shows the profile of this parameter:

Figure 2: Case-fatality rate of the SIRD model estimated on French data between March the 1st and April the 19th
The average value of this parameter over the studied range is 1.67%.
The order of magnitude of this parameter is consistent with estimates in the academic literature. For example, the fourth document (Society of Actuaries Research Brief Impact of COVID-19) provides a summary of values of the case-fatality rate for the COVID-19 in several geographical areas at different stages of the epidemic spread.
The infection rate is derived from the estimates of the number of reproduction ℜ0 and the parameters β and γ. Its average value is 20.22%.
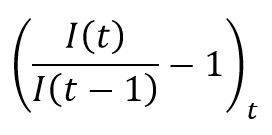
This estimate is consistent with the average level of the observed daily increase on the confirmed case series:

Which, under the assumption of SIRD spreading and under the condition of the equivalence S ≈ N, must be close to α – β – γ. The growth rate of confirmed cases from the 1st of March to the 20th of April 2020 is 16.52%, which leads to an infection rate of 23.42%, consistent with the estimate of 20.22% obtained above.
Following the calibration phase, the observed and theoretical cumulative numbers induced by the SIRD model were compared the 20th of April 2020, the subsequent table gives the values obtained:

Table 1: Observed and theoretical cumulative cases of compartments I, R and D based on French data until 04/20/2020
The theoretical numbers obtained are higher than the observed numbers. This overestimation is explained by the lockdown implemented in France from March the 17th, 2020. This measure led to a significant reduction in the dynamics of COVID-19, even though few parameters estimated during the first stage of the epidemic might lead to a more severe projected risk.
Conclusion
The SIRD model presented in this note is a first approach to pandemic modelling based on different population compartments and their respective interactions.
However, in order to improve the predictive capacity of this model, it is necessary to make several changes to the approach implemented.
For example, the numbers of infected and recovered patients must be corrected in order to integrate asymptomatic cases which, in the case of COVID-19, reach very high proportions (medical research mentions orders of magnitude for asymptomatic cases of 50% to 60%).
This data correction must be associated with an evolution of the SIRD model to include a compartment dedicated to asymptomatic individuals. This significantly increases the number of SIRD parameters to be estimated, but leads to a better modelling of the pandemic dynamics.
These data processing and modeling techniques will be presented in a subsequent article.
Carolina RAMIREZ, Regional Head of Consulting
Kevin POULARD, Actuarial R&D Leader
Auriol WABO, Consultant
Notes
[1] It should be noted that recent medical studies on COVID-19 do not confirm that recovered individuals are immune.
[2] Johns Hopkins University – https://github.com/CSSEGISandData/COVID-19
[2] Source data.gouv.fr – https://www.data.gouv.fr/fr/datasets/coronavirus-covid19-evolution-par-pays-et-dans-le-monde-maj-quotidienne/
[3] Anastassopoulou et al., Data-Based Analysis, Modelling and Forecasting of the COVID-19 outbreak, March, 2020
[4] Society of Actuaries Research Brief Impact of COVID-19 – April 16, 2020
[5] Massonnaud et al., COVID-19: Forecasting short term hospital needs in France, March, 2020
[6] Imperial College COVID-19 Response Team, Impact of non-pharmaceutical interventions to reduce COVID-19 mortality and healthcare demand, March, 2020

